Last updated: 2026-09-01
Why this matters: Most restaurants know what their total sales were at the end of the night, but very few know which specific dishes actually paid the rent and which ones quietly drained profit. Menu Engineering uses the proven 4-quadrant matrix (Kasavana & Smith) to categorize your dishes by popularity and profitability, giving you clear operational actions for every single item on your menu.
The 4 Menu Quadrants
Culizen automatically plots your dishes into one of four quadrants based on their sales volume (popularity) and gross contribution margin (profitability per dish):
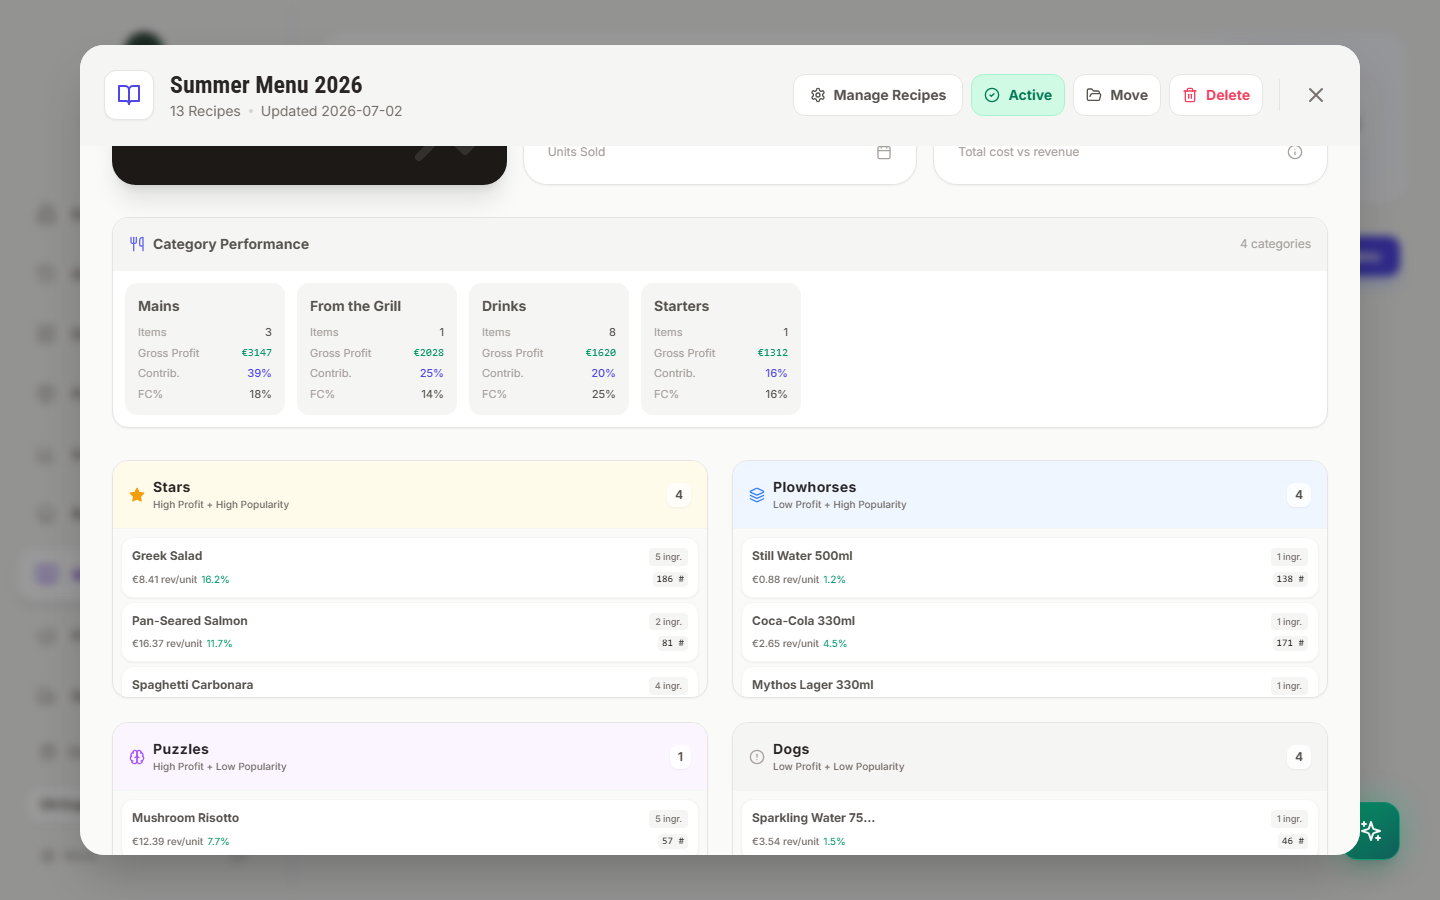
â Stars (High Profit + High Popularity)
- What they are: Your best performers. Customers love them, and they deliver healthy margins on every order (e.g. Greek Salad, Fresh Pasta, signature steaks).
- The strategy: Protect and feature them. Keep recipe specs tight and consistent. Position them in the "sweet spot" of your physical and digital menus. Never discount them.
🎠Plowhorses (Low Profit + High Popularity)
- What they are: High-volume crowd favorites that don't make enough money per plate (e.g. bottled beverages, classic burgers with expensive beef). They drive cash flow but weigh down overall food cost percentage.
- The strategy: Reprice or re-engineer.
- Raise the price by 5–10% — high popularity usually means low price sensitivity.
- Re-engineer the portion size slightly (e.g. 180g protein instead of 200g).
- Substitute a high-cost garnish or side with a higher-margin prep item.
🧩 Puzzles (High Profit + Low Popularity)
- What they are: High-margin dishes that simply aren't selling in volume (e.g. a high-end seafood risotto or artisan vegan entree).
- The strategy: Increase visibility and sales pitch.
- Brief front-of-house staff to recommend them during order-taking.
- Improve the menu description or photo.
- Reposition the dish to a prominent header or feature it as a daily special.
🕠Dogs (Low Profit + Low Popularity)
- What they are: Dishes that sell infrequently and deliver poor margins. They tie up inventory in prep items and pantry stock with high spoilage risk.
- The strategy: Remove or replace. Eliminate the dish from the next seasonal menu print, freeing up prep time and cooler shelf space for more profitable creations.
Feeding Sales Data into the Matrix
The menu matrix is powered by real dish covers and sales revenue. There are two ways to feed sales data into Culizen:
- Automated POS Sync (Recommended): Connect your POS (via Culizen Sales API, Delivery Manager, or W-POS). Shift-close Z-reports automatically ingest daily sales by channel.
- Manual Sales Entry: Enter daily or weekly dish quantities directly in the Menu Engineering view or Financials tab.
As sales accumulate, Culizen calculates the average menu popularity and average contribution margin, recalculating quadrant thresholds in real time.
Accounting for Delivery Platform Commissions
Selling a dish for €12.00 in your dining room is completely different from selling it on Wolt, efood, or Box where platforms charge a 20% to 28% commission.
Culizen provides separate channel pricing:
- Dine-in
- Takeaway
- In-house Delivery
- Platform Delivery
In Settings → Financials, set your blended delivery platform commission (e.g. 25%). Culizen automatically subtracts this fee from the gross selling price before calculating platform dish margins. A dish that looks like a Star in dine-in may actually be a Plowhorse or Dog on delivery apps — allowing you to adjust delivery menu pricing accordingly.
Category Performance Breakdown
Above the 4 quadrants, Culizen groups performance by menu section (Mains, Starters, Grill, Drinks, Desserts):
| Metric | What it tells you |
|---|---|
| Gross Profit | Total euro profit generated by this section |
| Contribution % | Share of total restaurant profit contributed by this section |
| Food Cost % | Weighted average ingredient cost percentage across the category |
Use this to ensure every section of your menu pulls its weight, and to identify whether food or beverage is driving your operating margin.